How to filter Intel XE Inspector results
Jan
7
Written by:
1/7/2013 3:16 PM

Intel Inspector is a C++ development tool that can be used to detect memory leaks and corruption.
Using this tool and when trying to detect memory leaks in our library, which uses the Misys Sophis toolkit, a lot of memory leaks are found, due to the fact that memory cache used by Sophis or our toolkit library are not correctly released: about 4000 are displayed after analysis. Infortunately, using existing filters provided by the Intel tool is not sufficient in order to detect which are relevant or not.
The subject of this post is then to provide methods which permit to filter memory leaks which are not due to a cache or static data allocated in the loaded dll's.
First, to detect memory leaks which are not due to memory allocation of caches, we construct a loop on some method we want to profile. Constructing a loop permits to be sure that a cache which is allocated won't be allocated twice. For example the following code could give a wrong memory leak:
static MyClass *ptr = NULL;
if(ptr)
delete ptr;
ptr = new MyClass;
Making a loop and analyzing the growth of the memory at the same time permits to detect if there are effective memory leaks or not. Once we are sure that there is an effective memomry leak, we use the Intel Inspector tool in order to give the list of memory leaks. When using the Sophis API and just calling the CSRApi::Initialise method, it will give for example such a list:
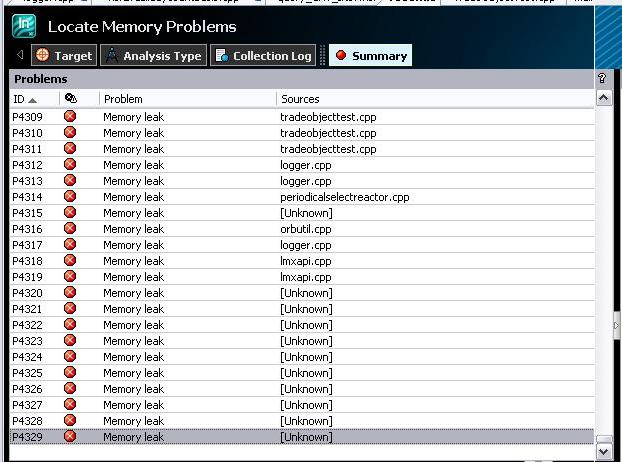
By taking a look at the detected memory leaks, most of the memory allocations are done in the method that does the initialisation of the Sophis API, CSRApi::Initialise. Other memory leaks are due to the fact that static data are not correctly released too. In order to detect them, it can be done by taking a look at the call stack: the MSVCRT initterm method should appear in the list, as shown the below figure:
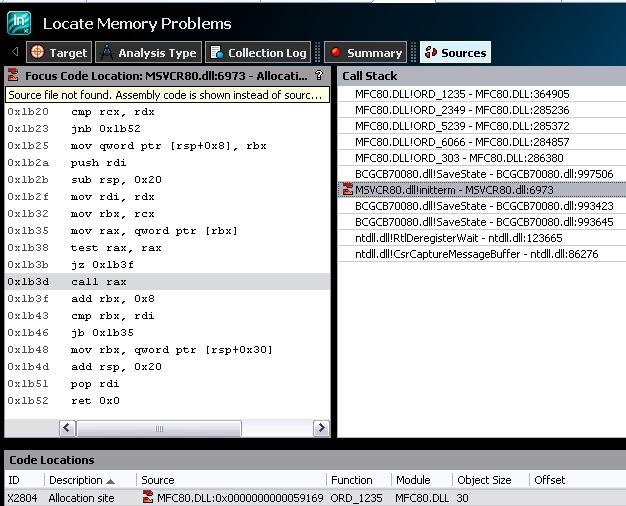
When parsing the leaks, we can see that for most of them, either CSRApi::Initialise or initterm are in the list of the methods displayed in the call stack. Our loop is done on the Sophis CSROption::RecomputeAll method, which corresponds to a calculation of a financial instrument. It means that we are only interested by memory leaks that occur in this method, or in the children methods called by this function.
Since the snapshot method provided by Intel Inspector does not work correctly as it was explained by the Intel sales person who told me that pushing the button on Intel Inspector XE 2011 update 6 does in fact nothing.., I did a reverse engineering of the tool in order to see if we can get the list of problems which do not contain the two functions in the call stack.
Taking a look at the Intel Results folder, we are getting this list of files:
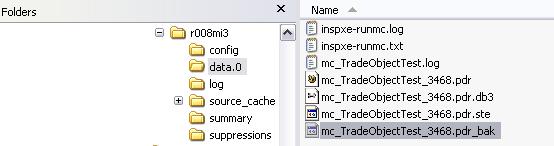
The .pdr file ((without any other extension) is in fact a XML file which contains the call stack of the different problems, the .pdr.db3 is by chance a SQLLite file. After a short analysis of the content of these two files, I decided to construct a .xsl file in order to get the list of the diagnostic ids present in the .pdr/XML file, to import them in the pdr.db3 file using a new table that I created, making a join between different tables in order to get the PID of the problems which do not have some method in their call stack.
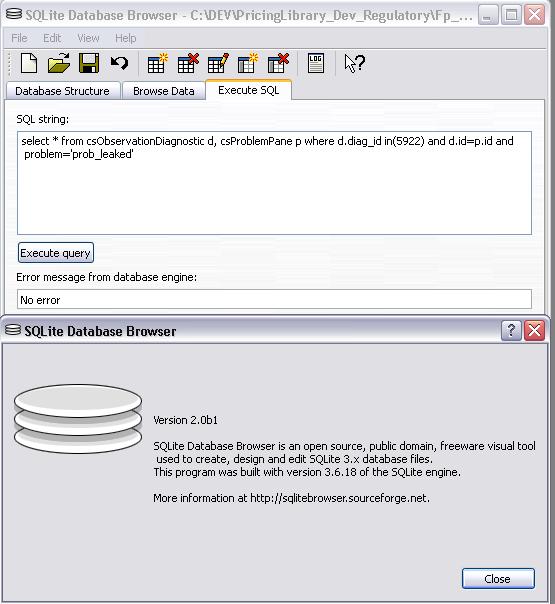
The .db3 file can be opened using a SQLLite browser like SQLLite Database browser available on the sourceforge server (and even on our server there):
The list of problems can be displayed using several tables: csProblem, csObservationDiagnostic (which gives the list of callstacks), csrProblemPane (which correspond to the view displayed in Visual Studio, in the top window), csObservationPane (displayed in Visual Studio in the bottom window).
By parsing the XML file with a xsl file which looks like the code below, we are able to get the list of the diag_id which are listed in the SQLLite database tables. Once these ids imported in a new table (csSophisApiIds) we are able to get the list of the PIDs which appear in the Visual Studio screen by using a SQL join between csSophisApiIds, csProblemPane and csObservationDiagnostic.
Code of the XSL file for getting the diagnostic ids and using the .pdr file as source file:
two files are used, one for CSRApi::Initialise, the other one for initterm. The .xsl files construct text files, as it is mentioned in the xsl:output tag. Since the HTML blog editor does not translate correctly the tags, I prefer to give the files directly: query_csrapi.xsl and query_initterm.xsl.
Using a XSLT processor like Saxon permits to extract the diagnostic ids, without out of memory problem. This is not the case with the XSLT processor provided with Visual Studio for example, when the .pdr file contains a lot of data (80Mb in my case). The command line to get the list of ids in the text file is then the following one:
java -Xms1024m -Xmx1024m -jar saxon9he.jar -s:myintel_results.dbr -xsl:query_initterm.xsl -o:ids_initterm.txt
Wooah... Now, since I've got the list of diagnostics, how to insert them in some SQLLite table?
First, I created a new table csSophisApiIds, with a XID field declared as NUMERIC. I used the "Create table "functionality of the SQLLite browser mentioned above. To do that, I opened the text file, select all ids and insert them in some Excel file. Using the CONCATENATE Excel macro, I was able to generate quickly the INSERT INTO statements with the right ids. Such an Excel file can be downloaded from there. Once the SQL statement generated, I copied them into the SQLLite database Browser and clicked on the Execute Query button.
Once the ids in my new table csSophisApiIds inserted, I just have to make the following query:
select * from csObservationDiagnostic d, csProblemPane p where d.diag_id not in(select XID from csSophisApiIds) and d.id=p.id and problem='prob_leaked'
It will give me only 39 results that I have to analyze myself, by double clikcing on the right PID in Visual Studio, instead of the 4 000 ones..
The Saxon Home Edition .jar used in this sample and provided freely from the time being by Saxonica can be retrieved there or directly on our server.