What to do when a C++ process is frozen on Windows?
Jan
10
Written by:
1/10/2013 4:48 PM

It's one of my best usual case: people are coming to me to see what happened when some server process on production is frozen. Of course, even if logs are written and dumped somewhere, in most cases, they are not enough to detect what happens really.
The same scenario occurs when an access violation is followed by a crash of the process, when we need a post-mortem analysis.
Everybody could tell me that we just have to write such a treatment in C# or Java to get the call stack at this moment, but the subject of this post is not what development language to use but what to do when something like that occurs on a production server.
The procedure to follow in order to do something is the following one:
1 - when generating releases for the production, keeping somewhere the .pdb files (if using Visual Studio as compiler). If it is not the case, normally, sources are kept somewhere and binary files could be generated again using the right source baselines/tags.
2 - when the process is frozen, not delete it without creating a minidump file. A minidump file is a file which contains all information necessary to debug it: the state of the registers, the list of threads, the content, the content (and size) of the memory heap and so on.... A pretty good tool to generate minidumpwithout installing Visual Studio is procdump. It is provided by ex-SysInternals/Microsoft and is available for download there on the MS website or there.... Using this tool, in order to create a minidump on an exiting inline-process, we just have to run the following command for an X64 process:
procdump -64 -ma myexename.exe
The minidump will be generated in the current directory using the name of the process, the hour and current minutes.
3 - Once the minidump generated, open it using the Visual Studio by clicking on File/Open Solution and selecting the dump file extensions:
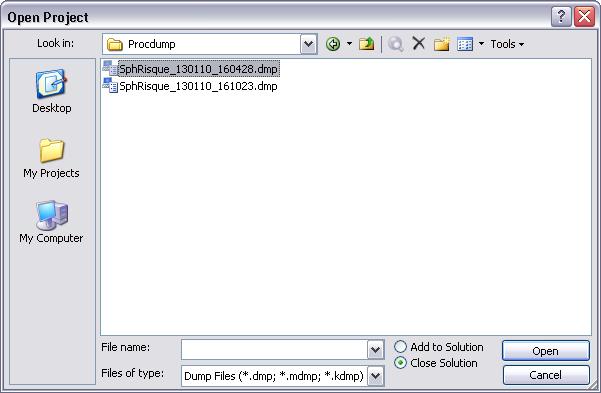
4 - in order to display the state of the registers, the call stack and all the content of the data stored in the minidump, just make a F5 (debug) and it will be displayed. If the .pdb files are right, the adresses will correspond to the source code.
Moreover, for a detailed review on how to use the minidump files, it can be retrieved from the very good post on Codeproject, available there.