Win64: how to capture the process status when it crashes?
Apr
3
Written by:
4/3/2014 2:29 PM

More than one year ago, I wrote an article on what to do when a process is frozen, and how to dump the memory and registers into a .dmp file in order to use it after with Visual Studio (whatever the version).
But, unfortunately, sometimes the process crashes and disappears from the task of processes provided by taskmgr.
By chance, there is a way in Windows to declare an executable, known as JIT Debugger, that will be called when an unhandled exception is detected. The executable procdump mentioned in the previous post can be used. This post will describe how to install it and will show how to use the resulting .dmp file.
On x64 bits Windows OS, there are two entries to declare the JIT debugger. These entries have to be declared in the registry, under the key HKLM\SOFTWARE\Microsoft\Windows NT\CurrentVersion\AeDebug, one using the regedit.exe present in the c:\windows\system32 folder for the x64 executables, the second one using regedit.exe present in folder c:\windows\syswow64 for the x86 executables.
The following screenshot describes the keys to add:

-64 is used for x64 executables, as described in the usage help of procdump.
It can be installed using the following command too:
procdump -64 -ma -i c:\temp\sysinternals\lastdump.dmp
The only problem is that -64 is not taken into account and that the registry key hhas to be edited in order to modify it after for x64 executables.
That's all, the machine is then ready to dump any status of the process that will crash.
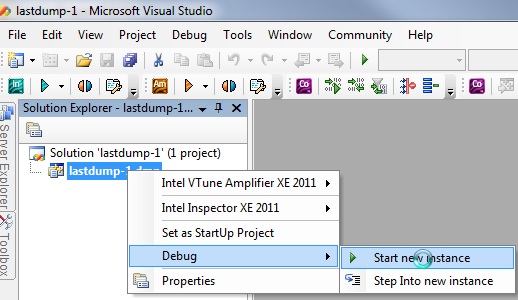
Once crashed, the .dmp should be present in the folder configured in the registry key. Note that files are not overwritten and that a number is added at the end of the name. Taking the last one, it can be copied on a machine where Visual Studio is installed with the current code and .pdb files. It can be opened directly by right-clicking on the .dmp file, or by opening a project file using the Dump files filter in the Visual Studio open project dialog.
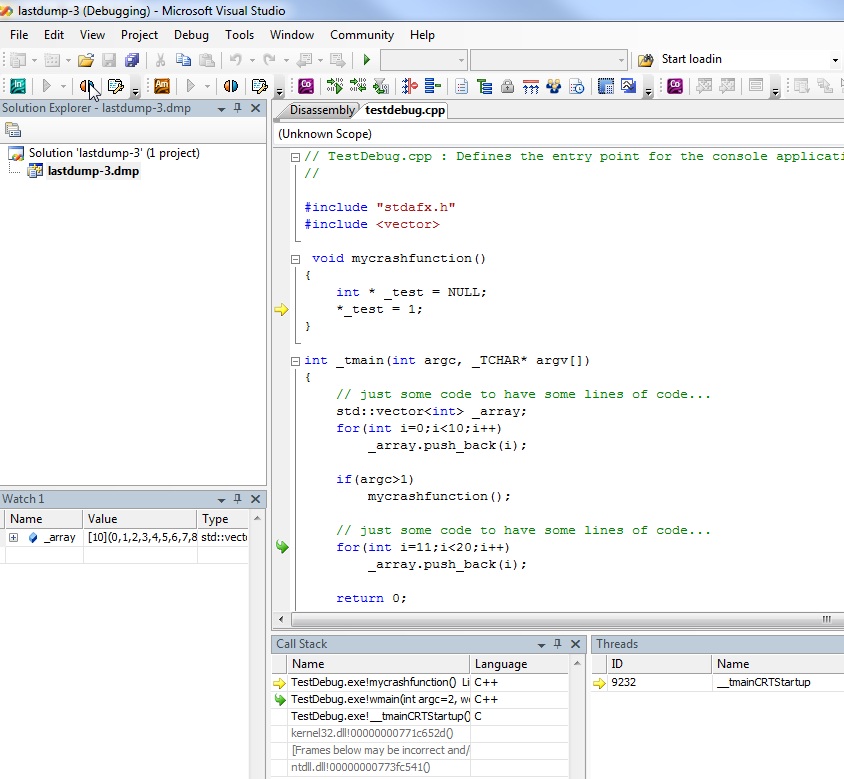
Once opened, in order to see where the crash occured in the code, just make step into:
Then, the line on which it crashes will be shown (in yellow), and the call stack, the threads present, and the content of the variables can be analyzed as below:
1 comment(s) so far...
Re: Win64: how to capture the process status when it crashes?
Concerning the string to put in the registry, the right one is for example the following one:
"C:\Program Files (x86)\Sysinternals\procdump.exe" -64 -ma %ld "c:\temp\lastdump.dmp"
By Philippe Bonneau on
10/14/2015 10:49 AM
|