C++: just another tool to detect memory leaks
Sep
26
Written by:
9/26/2014 4:58 PM

In my precedent articles that I've published concerning the memory leaks (C++ memory leak check on x64 platform and test of different tools and How to filter Intel XE Inspector results), I was talking about the fact that for huge programs like Sophis Risque, the debugging using such tools is quite difficult to do. In fact, in some cases, I've found no tool that can do the job as I wanted. Using a tool like Intel Inspector gives sometimes so many errors that it is quite difficult to detect the real problem. That's why I've developped one tool that permits to detect easy bugs without impacting the whole performance during all the test but just for a piece of code that could interest me. The goal of this post is to present this tool.
The tool is composed of one dll, .lib and header files. The first version of this tool was using the overriding of the new and delete operators. This is possible by using for instance the following code:
inline void __CRTDECL operator delete(void* p)
{
// TODO
free(p);
}
inline __bcount(_Size) void* __CRTDECL operator new(size_t _Size)
{
void *ptr = (void*)malloc(_Size);
if(ptr==NULL)
throw std::bad_alloc();
// TODO
return ptr;
}
inline __bcount(_Size) void* __CRTDECL operator new[](size_t _Size)
{
void *ptr = (void*)malloc(_Size);
if(ptr==NULL)
throw std::bad_alloc();
// TODO
return ptr;
}
inline void __CRTDECL operator delete[](void* _P)
{ ::operator delete(_P); }
Once this code stored in a header file, we just need to include the header file in a precompiled header, stdafx.h for example, and all new and delete operators will be overriden in the current project (more eaxctly in all .cpp files where the precompiled header is used). In the //TODO comments, I've added some code in order to get the current call stack and to store the address. When deallocated (on the delete), I just need to remove it from the map where it was stored. And since it is directly used in the compiled code, on x64 compilation, there is almost no limitation to store the callstack (not like Intel Inspector XE2011 which is a x86 tool making some remote debugging).
Some could think that, instead of using such a mechanism, we just need to use _CrtSetAllocHook provided by the MS runtime debug dll's. Unfortunately, in projects where third parties dll's are used and compiled in release mode, this is not possible, since the debug MS runtime and release ones cannot be loaded at the same time.
The overriding of new and delete operators was the method used until I've discovered how to patch dynamically allocation functions like malloc, calloc, free, VirtualAlloc... This is a better method: it permits to debug at the same time all allocations and deallocations done by a third party software, even if we don't have the code. Otherwise, instead of debugging from scratch and from the beginning a whole program, I've added some methods to start the patch, and to stop it. I remember the remark done by an Intel engineer on Intel Inspector: they didn't want to enable such an option in their tool because it declares too many wrong positives... Some remark like that is really a joke! I've prefered to add in my tool a method that permits to exclude call stack paths, when I know that the memory leak detection is wrong. A wrong positive is done by some code like that:
MyObject* m_ptr = NULL.
void SomeFunction()
{
ITQStartLMemoryTracking(10,true);
if(m_ptr)
delete m_ptr;
m_ptr = new MyObject();
ITQEndMemoryTracking();
ITQDumpUnfreed();
}
Finally, I can obtain the list of memory leaks in the output window of Visual Studio, or if I prefer to store it, in a file.
Some samples:
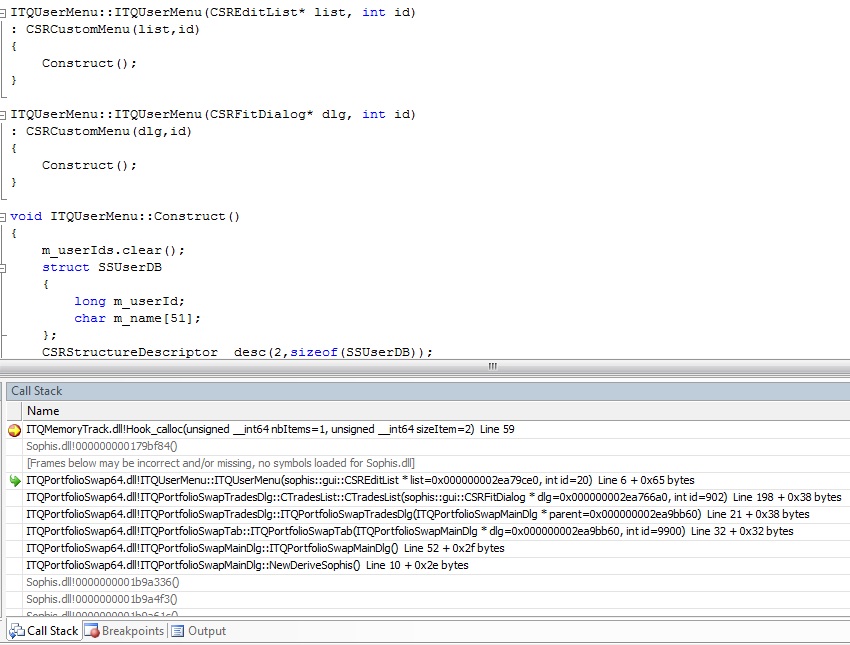
1 - In the figure below, it indicates that the tool can track memory allocation done in a third party dll named Sophis.dll:
.
2 - The source of one memory leak can be displayed by double clicking on the line too: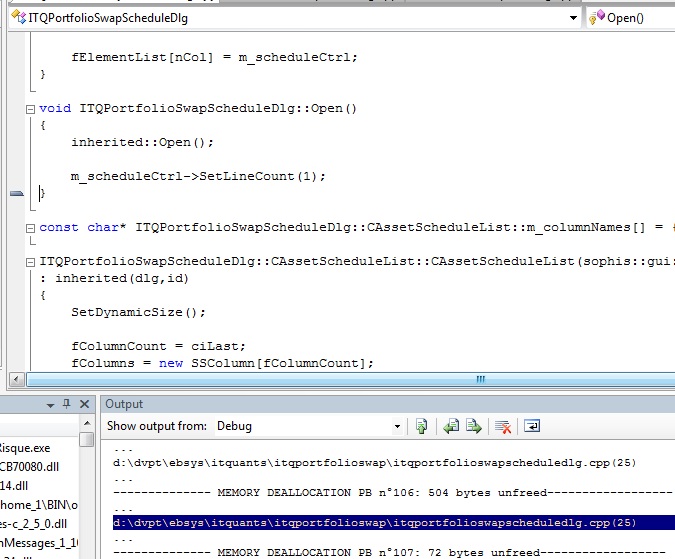
Code: this time, I don't give it. If you want to use it, I will be happy to explain it privately :). For any contact, just connect to me there: http://www.linkedin.com/in/pbonneau.